Confluence Signals
A probability-based indicator designed to reduce bad decisions.
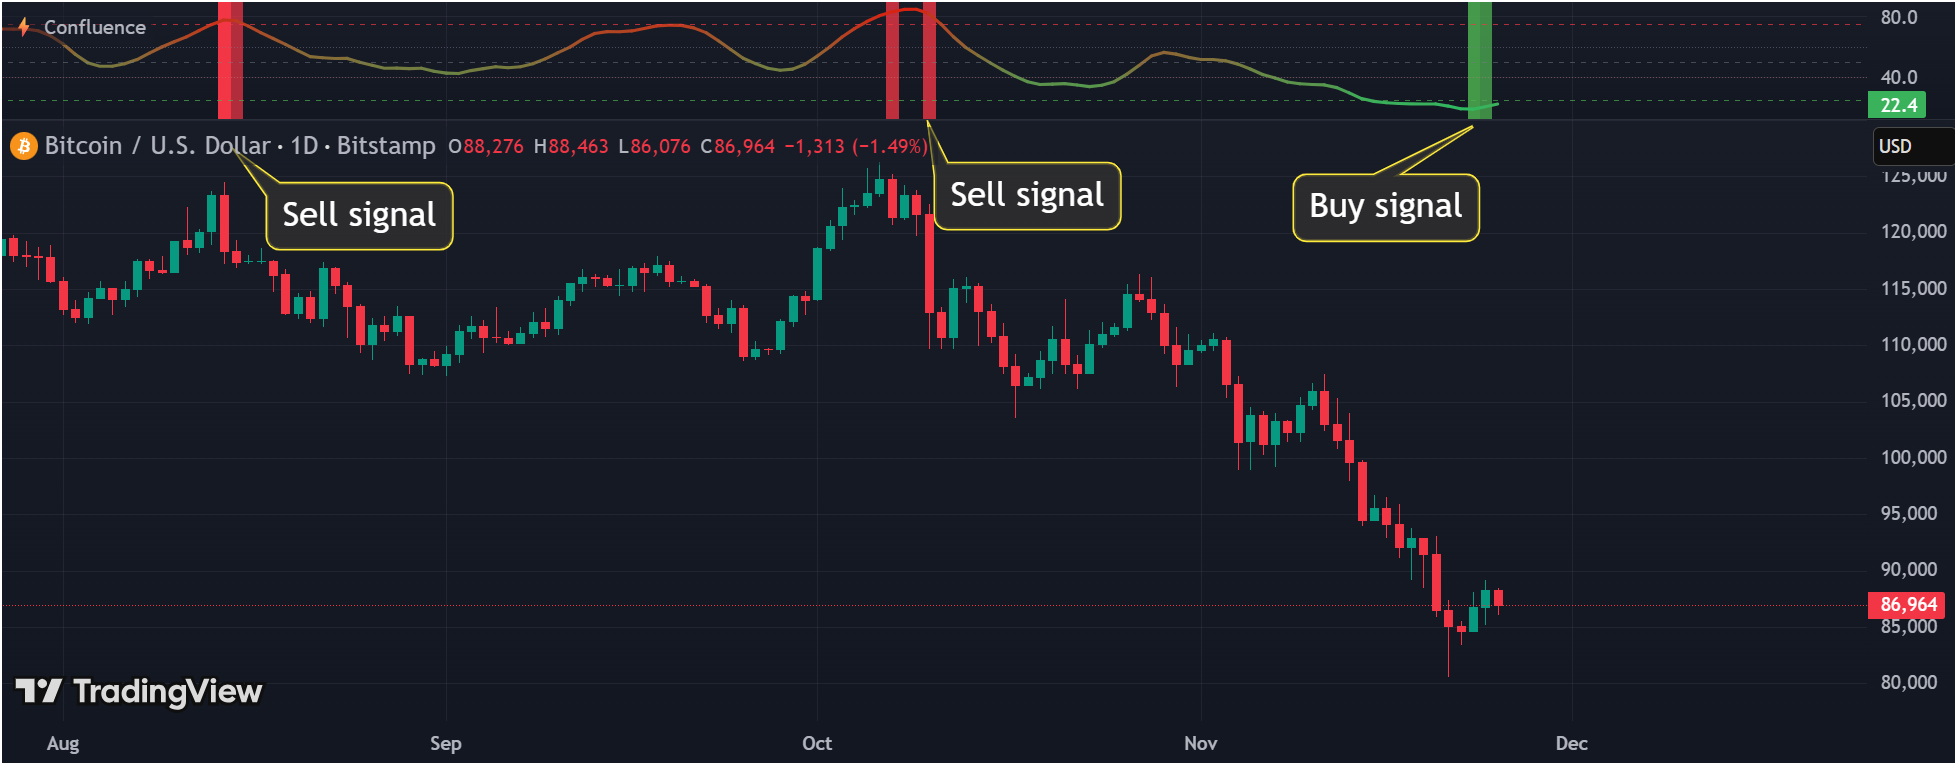
Highlight probable buy and sell moments.
Confluence reflects aligned market signals.
The why
"A confluence is where two or more signals merge into one. The word comes from the Latin confluentia meaning 'flowing together.'"
This indicator was created to stop making stupid trading mistakes. Not to find perfect entries. Not to predict the future. Just to reduce bad decisions.
Gut feelings aren't a strategy
Emotions and hope often lead to costly mistakes. This indicator replaces subjective judgment with structured, data-driven confirmation.
The best trade is sometimes none
When the market is unclear, the best position is often no position. This indicator stays quiet on purpose when conditions don't align.
Most losses come from poor decisions
One RSI reading or one MACD cross is not enough. The problem is usually emotional reactions, overtrading, and acting on isolated signals.
Confluence as a guardrail
Multiple independent confirmations must align before the Confluence Signals indicator highlights a potential opportunity. This filters out noise.
Then - better timing
Once discipline and filtering are in place, identifying better buy and sell windows becomes easier and more consistent.
The goal is not perfection. The goal is to make fewer impulsive trades, filter out noise, and only act when multiple factors align. The indicator is a filter first, and a signal second.
Quick start
Three steps to get started without overcomplicating things.
Request access
Click and enter your email. We'll send you the indicator link.
Learn the probability zones
Understand what 0–25 (bullish), 25–75 (neutral), and 75–100 (bearish) mean before acting on any signal.
Use it to filter trades
Focus on filtering out bad trades first. Don't chase entries - let the indicator reduce noise.
Tip
How it works
The indicator aggregates multiple independent confirmations into a single probability score. Here's the simplified flow.
What it provides
- ✓Insight into market momentum
- ✓Noise filtering through confluence
- ✓Clear probability zones
- ✓Environmental context
What it does not provide
- ✗Certainty or guarantees
- ✗Automatic trade decisions
- ✗Position sizing recommendations
- ✗Risk management for you
The four forces
Every trading decision can be understood through four fundamental market forces. Confluence Signals monitors all of them.
Trend
→directionIdentifies the prevailing market direction. Are we in an uptrend, downtrend, or ranging?
Momentum
→timingMeasures the speed and strength of price movement. Is the move accelerating or fading?
Volume
→confirmationValidates price movements with participation. Is the move backed by conviction?
Volatility
→risk & expansionGauges market uncertainty and potential range. How much can price move against you?
True confluence occurs when multiple forces align. No single force tells the whole story.
Probability score & zones
The indicator outputs a score from 0 to 100, divided into three meaningful zones. The middle zone represents intentional inactivity.
Bullish confluence zone
Multiple indicators align in a bullish direction. Conditions are favorable for long positions.
Uncertainty zone
Indicators are mixed or neutral. This is a deliberate "do nothing" signal. The indicator is quiet here on purpose - it means there is no clear confluence in either direction.
Bearish confluence zone
Multiple indicators align in a bearish direction. Conditions favor shorts or taking profits.
Reference lines at 25 and 75 mark the zone boundaries. The indicator is designed to spend significant time in the middle zone - this is intentional, not a flaw.
Dual confirmation
Background colors appear only under strict conditions. This is the highest level of confluence the indicator can show - and it is intentionally rare.
Bullish background
Appears when all indicators in the Confluence Signals indicator agree on bullish conditions simultaneously. This represents maximum bullish confluence.
Brightness reflects cycle maturity - brighter means more confirmed.
Bearish background
Appears when all indicators in the Confluence Signals indicator agree on bearish conditions simultaneously. This represents maximum bearish confluence.
Brightness reflects cycle maturity - brighter means more confirmed.
Why this strict rule?
Requiring all indicators to agree makes false positives rare. When you see a background color, multiple independent systems are pointing in the same direction. This is environmental context - it shows market alignment.
Components overview
The indicator combines multiple analysis systems, each contributing to the final score. Click each component to see advanced details.
Advanced detail
Combines volume patterns, price action, and momentum to identify Wyckoff phases. Uses volatility cycles to detect regime changes. Weighted heavily because cycle awareness prevents trading against the broader trend.
What it provides
- + Phase awareness
- + Cycle position
- + Trend context
What it does not solve
- − Exact reversal timing
- − Future phase prediction
Advanced detail
Includes RSI, MACD, Stochastic, OBV, ADX, Bollinger Bands, Ichimoku, Moving Averages, CCI, Williams %R and more. Each indicator contributes to the overall score. Dual confirmation backgrounds require all 10 signals to agree.
What it provides
- + Multi-indicator alignment
- + Visual confluence indication
- + Quick assessment
What it does not solve
- − Indicator conflicts
- − Which indicator to trust
Advanced detail
Analyzes trend direction on higher timeframes relative to the chart timeframe. Signals are stronger when all timeframes point the same way. Prevents trading against higher timeframe trends.
What it provides
- + Timeframe alignment
- + Trend confirmation
- + Context from higher timeframes
What it does not solve
- − Timeframe selection
- − Scalping entries
Advanced detail
Dynamically adjusts smoothing based on volatility. High volatility = more smoothing to reduce whipsaws. Low volatility = less smoothing for responsiveness. Uses ATR-based calculations.
What it provides
- + Noise reduction
- + Cleaner signals
- + Volatility adaptation
What it does not solve
- − Lag elimination
- − Perfect timing
Advanced detail
Feature engineering on price, volume, and indicator data. Real-time learning adapts to recent market behavior. Conservative implementation - reduces false positives rather than predicting moves.
What it provides
- + Pattern filtering
- + Quality assessment
- + Adaptive learning
What it does not solve
- − Future prediction
- − Guaranteed accuracy
Advanced detail
TD Sequential (9-count timing), Squeeze Momentum (volatility breakouts), Twiggs Money Flow (volume-price), Inverse Fisher Transform (noise reduction). Elliott Wave structure validation (5% weight) for wave pattern confirmation.
What it provides
- + Timing signals
- + Momentum confirmation
- + Volatility context
What it does not solve
- − Elliott wave counting
- − Perfect timing
How to read the indicator
A practical workflow for using Confluence Signals in your trading process. This is a framework, not a rigid system.
Determine market context
Before looking at signals, understand the current market environment. Is it trending or ranging? What is the higher timeframe bias?
Use probability zones to filter
If the score is in the 25–75 zone, there is no clear confluence. This is the indicator telling you to wait, not to force a trade.
Look for confluence, not triggers
Look for alignment between the indicator and market context. Confluence means multiple factors agree.
Define invalidation and risk
Before entering, know exactly where you are wrong and how much you are willing to lose. The indicator does not set stops for you.
Execute your plan
Make the decision and execute. The indicator informs; you decide.
Accept variance
Some trades will lose despite good confluence. Some will win despite weak confluence. This is normal.
What this indicator is not
- • Not an entry/exit generator - it shows confluence, not trade commands
- • Not a strategy - it is a decision support tool within your strategy
Settings
The default settings are calibrated for general use across most markets and timeframes. Understand what each setting does before changing it.
Core parameters
Base settings for the indicator's calculations.
Automatically adjusts parameters based on volatility. Leave on unless you understand the implications.
Core calculation period. Higher values = smoother but more lag. Lower = responsive but noisier.
Changing core parameters without understanding them can degrade signal quality.
Avoid overfitting
Alerts
TradingView alerts can notify you when confluence levels are reached. Alerts are prompts to review, not commands to trade.
Strict threshold alerts
Only triggers when confluence reaches maximum levels. Fewer alerts, higher quality. Best for traders who want to be notified only of the strongest setups.
- • Few false positives
- • High confluence required
- • Less noise
- • May miss some valid opportunities
- • Alerts are infrequent
Sensitive threshold alerts
Triggers on moderate confluence levels. More alerts, requires more filtering. Best for active traders who want early warnings.
- • Catches more opportunities
- • Earlier notification
- • More data points
- • Requires manual filtering
- • More noise
- • Not all alerts are actionable
Alerts are review prompts
When an alert fires, conditions have reached a threshold worth reviewing. Check the chart, assess context, then decide on action.
Setting up alerts in TradingView
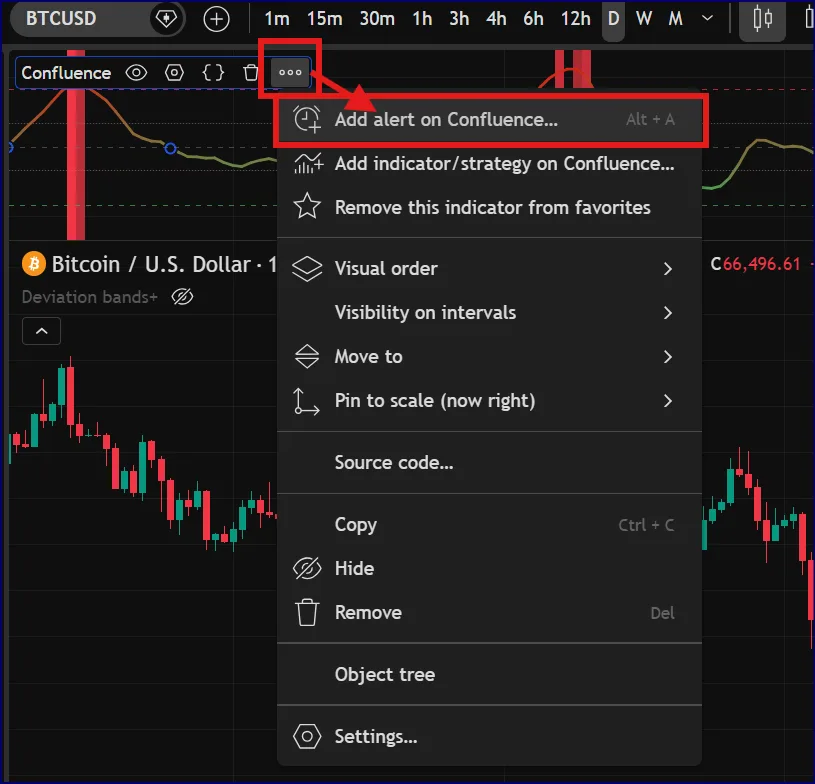
- 1.Right-click on the indicator pane and select "Add Alert"
- 3.Configure notification method (app, email, webhook)
- 4.Set expiration and confirm
Frequently asked questions
Common questions about the indicator, its behavior, and proper usage.
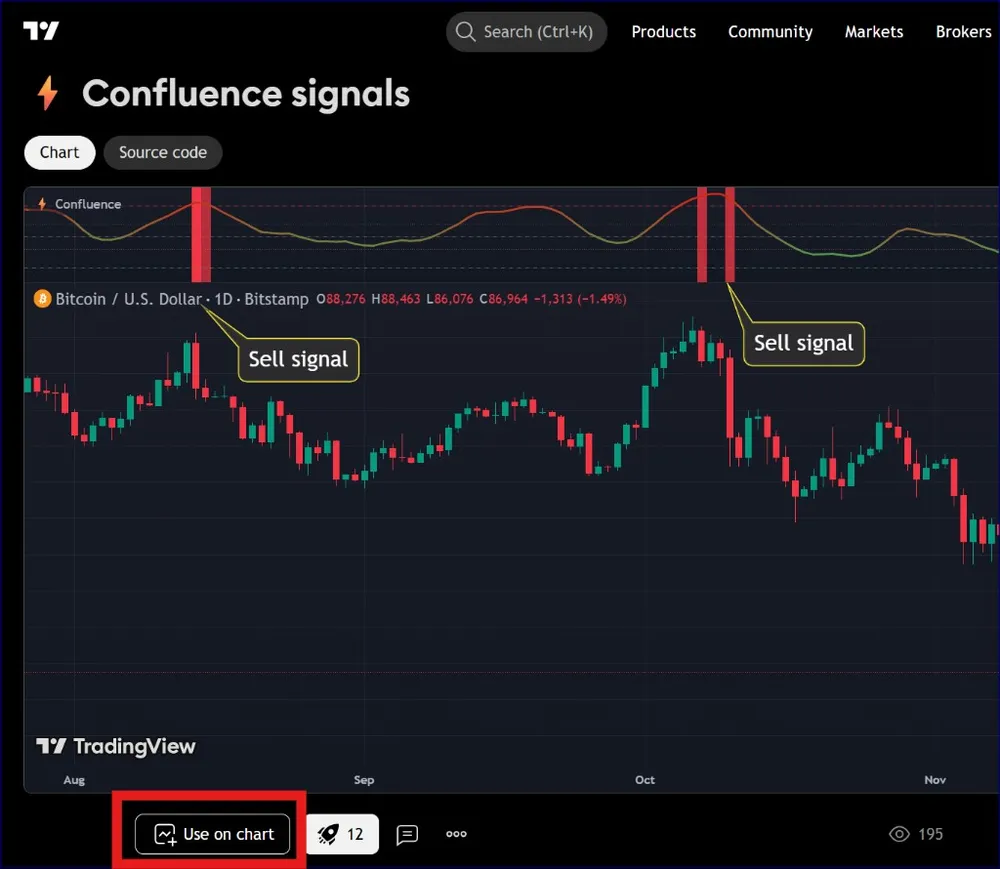
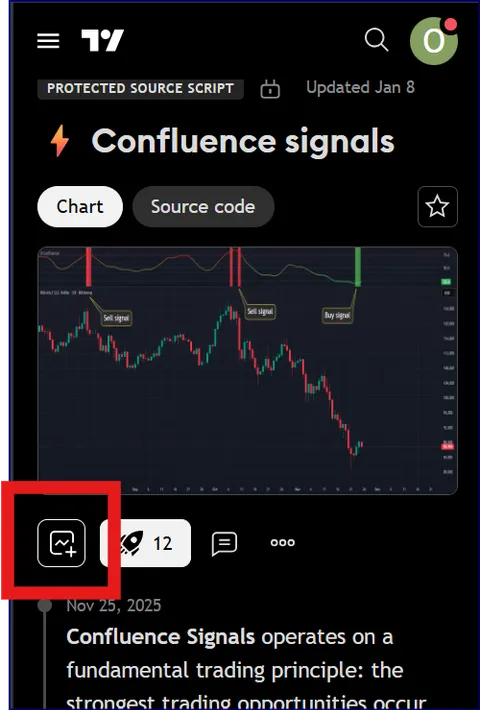
Click the "Use on chart" button on the indicator page — it's highlighted in red below. TradingView will instantly add it to your active chart. No manual script installation needed.
There are two ways to set up alerts. Choose whichever fits your workflow:
Method 1 — From the chart
Click the ••• menu on the Confluence indicator in your chart, then choose "Add alert on Confluence..." (or press Alt + A). The alert dialog opens pre-filled for this indicator.
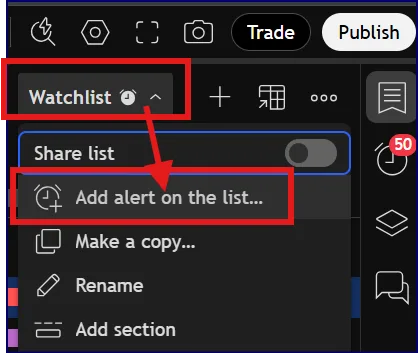
Method 2 — From the Watchlist
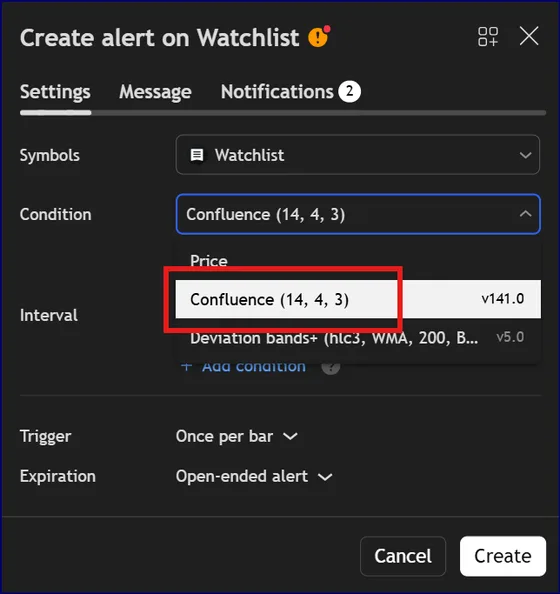
Open your Watchlist, click the ••• menu next to the list name, choose "Add alert on the list...", then select "Confluence" as the condition.
The indicator is designed to minimize repainting. Signals are confirmed at bar close, not during the bar. However, like all indicators that use current price data, the probability line will update as the current bar develops. Final signals are stable once the bar closes.
The indicator is market-agnostic and works on any liquid market (crypto, forex, stocks, commodities). It performs best on timeframes from 15 minutes to daily. Very short timeframes (1-5 min) have more noise; very long timeframes (weekly/monthly) have fewer signals. The 1H and 4H charts are popular choices.
This is intentional. The indicator requires multiple confirmations before highlighting an opportunity. Fewer signals means higher quality - the filter is working as designed. If you want more signals, you may need to reconsider your expectations. More signals rarely means better results.
Beginners should use the indicator primarily as a filter - to avoid bad trades rather than find perfect entries. Leave settings at default and focus on the probability zones. Advanced traders can explore the component weightings, adjust thresholds, and integrate the indicator into their existing strategies as one data point among many.
The indicator includes a built-in performance tracker that shows historical win rate and returns based on signal alternation. However, past performance does not predict future results. The backtest is for reference only - use it to understand how the indicator behaves, not to predict profits.
This is an indicator, not a strategy. A strategy defines entries, exits, position sizing, and risk management. This indicator provides confluence information to support your decisions.
The probability score (0-100) shows the current confluence level as a continuous value. Signals (buy/sell labels) appear when the score crosses into extreme zones and certain conditions are met. The score is always visible; signals are discrete events that require threshold crossings.
You can set up alerts that trigger webhooks for automated execution. However, the indicator is designed for decision support. Automation removes context that makes signals meaningful.
Signals can fire when the score is transitioning through the neutral zone if other conditions (like signal alternation and enhanced indicator confirmation) are met. The zones are guidelines, not hard boundaries. Context from the full indicator system matters more than the exact score.
Higher confluence (closer to 0 or 100), dual confirmation backgrounds, and alignment with higher timeframe trends all increase probability. No signal guarantees success.
Support development
Confluence Signals is built and maintained independently. Donations help support ongoing development and improvements.
Monero(XMR)

Wallet address
849EDQuuyfzct2hbX91wscQYdZSp7H3yZCb9vHmqb9bHXoBAVVXboGE4Rrm62SyDodGHy7BZ7sLrqSCuzBQR33fh6RZQCTd
Donations are entirely voluntary and do not unlock additional features. The indicator remains freely available to all TradingView users.